Community Dynamics

Variations in populations are based on differences in the genes carried by the chromosomes in the individuals. Genes determine an organism's appearance and mutations in the genes cause new variations to arise. These mutations can be passed on to subsequent generations. Some genotypes are better equipped for survival than others. This may be because they are better at obtaining food and water, or protecting themselves from predators or have a higher reproductive potential. When these organisms reproduce, their genes will be transmitted to their offspring. The offspring will be better able to survive; therefore, subsequent generations would have a relative increase in the frequency of these variant genes.
This brings up the concept of natural selection. For natural selection to occur, two conditions must be met;
Survival from a natural selection perspective must be looked at from two angles, not only should the individual be able to stay alive and thrive, they should also be able to reproduce and pass on their genetic material to subsequent generations.
A population refers to all of the individuals of the same species living in the same geographical place at a certain time (temporospatial).
A community is made up of the populations of all organisms that occupy an area. A community is therefore made up of multiple species.
An Ecosystem describes the combination of communities (biotic components) and abiotic (non living) components of an area.
A habitat is the physical area where a species inhabits. Within a habitat, every population occupies an ecological niche, which is the population's ecological role in the community, including the biotic and abiotic factors under which a species can successfully survive and reproduce.
Population patterns can be divided into three patterns:
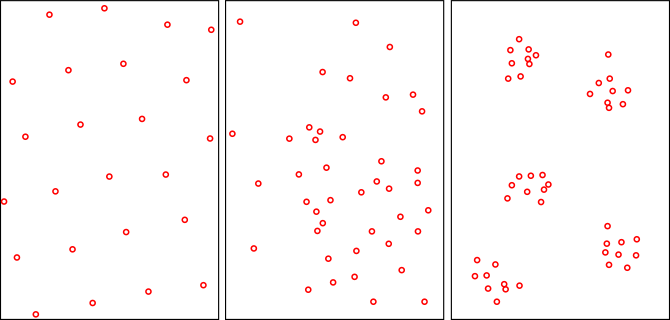
Three patterns of population distribution, from left to right - Uniform, Random and Clumped. (Source: Wikipedia-CC BY-SA 3.0)
Population size is the number of organisms of the same species sharing the same habitat at a specified time. These numbers may arise from an exact count or an estimate of the total population size using sampling methods.
Population density refers to the number of organisms per unit space/area. The density (D) of any population is, therefore, calculated by dividing the total number of individuals counted (N) by the area (A) occupied by the population. i.e. Dp = N / A. If the habitat is a liquid, you can replace area (A) by the volume (V).
Two or more population densities can be compared by determining if there have been changes within the same population over a certain time period (i.e. The rate of change/growth rate). The rate of density change can be expressed as Change in density / Change in time. This must be calculated showing the most recent dates minus the density at the earliest date, this will show whether there has been an increase or decrease in the population. This is the same as the Growth rate formula. If a population is reducing in size, the rate of change will be expressed as a negative value.
There are four factors that determine population size:
Population growth can be determined by the following formula:
PG = (births + immigration)-(deaths + emigration) OR (b+i)-(d+e)
PG (as a %) = [(b+i)-(d+e)x 100 ]/ initial number of organisms (n)
In mature ecosystems, populations tend to remain relatively stable over the long term, this is called dynamic equilibrium or steady state. Dynamic equilibrium is similar to homeostasis at an ecosystem level. Populations will adjust to changes in the environment to maintain equilibrium, by either increasing or decreasing reproduction and other interventions.
Populations can either be classified as Open or Closed. In an open populations, all four factors (natality, mortality, immigration and emigration) are functioning, while, in closed populations, immigration and emigration do not occur, so changes in natality and mortality will be the only factors that can impact population size.
A J-shaped population curve occurs in ideal circumstances/ideal environments. If a few relatively active individuals are placed in an ideal environment where there is unlimited space, food, water, without disease and predation, the population can be expected to reproduce at its maximum physiological rate. The only limiting factors would be the rate of gamete formation, mating and survival of offspring. The population size will look like a J-shaped curve, because of rapid population growth. The quick increase in population may exceed the carrying capacity, which then causes a sharp population decrease. In most cases this is usually followed by a relatively stable stationary (equilibrium) phase.
The S-shaped (sigmoid) population curve occurs in real life situations where limiting factors limit population growth and the curves tend to level off. Growth curves for open populations typically form S-shaped curves. If you think of a bacterial culture on a petri dish, a nutrient is added at the beginning of the curve, which results in a growth phase, the growth phase is initially slow, but gradually increases due to the exponential growth (exponential phase) of bacterial cells. Finally, this is followed by a stationary phase/Plateau phase where once again where the curve levels off. The maximum number of individuals that the environment can support has been reached this number is now the new carrying capacity (K). Biotic potential (Rmax) is the maximum number of offspring that can be produced by a species under ideal conditions.
There are six factors that regulate biotic potential:
In populations with limited resources, four definite phases can be identified in the curve. Lag Phase is the initial phase where there is a delay that occurs before the population enters a phase of active reproduction. The individuals are getting accustomed to the environment, obtaining nutrients and finding mating partners. The Growth Phase occurs when the population increases at its fastest rate. The rate of natality is greater than the rate of mortality. In microorganisms, this growth rate occurs exponentially. The expected/predicted population increase in a given time (I) can be calculated as growth rate (R) x current population (N). The Stationary Phase occurs at the point where the population size no longer increases. This may be due to a lack of space, a shortage of nutrients and an accumulation of toxic metabolic wastes. The rates of natality are equal to the rates of mortality. The Death Phase occurs when the mortality rate exceeds the natality rate. This might occur if nutrients run out and wastes accumulate to a level where they may become toxic to the individuals, e.g. accumulation of ammonia.
The law of the minimum states that, of the set of essential substances required for growth, the one that is available in the minimum concentration is the controlling factor. On the other hand, Shelford's Law of Tolerance states that Too little or too much of an essential factor can be harmful to an organism. Therefore, there is an optimal range of conditions for maximum population size.
There are two general categories of limiting factors in an environment:
K selected populations
r selected populations
Life history patterns are population cycles that include growth and decline. These occur in many populations. For example, the snowshoe hare and lynx have cycles that are about 11 years in length.
Population histograms are graphical representations of the population size separated by gender and age. Population histograms can be used to predict whether a population will grow, stabilize, or decline. For example, an age pyramid with a wide base is characteristic of a rapidly growing population. It indicates a high number of young offspring, but also shows the number of individuals capable of reproduction. Population histograms with a narrow base are often low or null population growth, and those with a narrower base than middle section are showing declining population growth.
When two or more populations of organisms occupy the same ecological niche, one of the populations will be eliminated. This is known as Gause's Principle and occurs due to interspecific competition between similar species for a limited resource such as food or water. Intraspecific competition occurs within an ecological niche of members within the same species.
Predation occurs when one species feeds on another species for its survival. The species that feeds is the Predator and the victim is the Prey. There are several ways in which preys can avoid predation, these include:
Symbiosis occurs when two different organisms live in a close association and develop a relationship for survival. There are three main types of symbiotic relationships:
One way of examining why some features of nature are so unpredictable is the chaos theory. This theory proposes that randomness is a basic feature of many complex systems; long-term predictions may be extremely difficult. Even though features of nature are so unpredictable, they often share similar characteristics: Outcomes of processes in a complex system are extremely sensitive to small differences in the conditions that were present when the process began. Once a process is underway, the relationships among the interacting parts of the phenomena can change because of the interactions themselves. Two systems that appear similar at the start may end up being very different, but how the two will differ is unpredictable. The inability to predict the precise makeup of a community does not mean that communities are entirely unpredictable: communities tend to undergo predictable changes over time called succession.
Succession is the slow, orderly progressive replacement of the community by another during an areas development succession ends by reaching a climax community there are two possible types of succession:
Succession assumes that species composition changes more rapidly during the earlier stages of succession. The total number of species increases dramatically during the early stages of succession, begins to level off during intermediary stages, and usually declines and the climax community becomes established food webs become more complex and the relationships more clearly defined. As succession proceeds, both the total biomass and nonliving organic matter increase during succession and begin to level off during the establishment of the climax community.
You can access Tensai High School Biology revision questions HERE